Mining & Energy Report

Tier 1 — Strongest Bullish Sector

Industrial Metals & Mining (avg momentum +2.3%, 79% of names positive — the most broadly bullish sector in this dataset)

This is the clearest confirmation yet of the “Industrial Metals” theme running through both prior reports (Copper/Coal/Aluminium commodity strength → FTSE Industrial Metals & Mining sector strength → Nucor/Steel Dynamics equity strength). Here it shows up a third time, now in the small-cap miners.

Trend buy: Critical Metals Corp (CRML) — long-term stoch only 14.7 but fast stoch already 57.9 and momentum +14.8%, the single strongest reading in this entire dataset — a genuine breakout, not just noise. Reversal buy: enCore Energy (EU) — long-term stoch just 11.5 (deeply oversold on a 200-period basis) with fast stoch already recovering to 56.6 and momentum +13.1% — a textbook base-and-breakout, uranium/battery-metals exposure. Sell: Nexa Resources (NEXA) — stochastics still elevated (71.5 long-term) but momentum has collapsed to -6.2%, the sector’s worst print — a name rolling over from a high base, classic topping divergence.


Tier 2 — Precious Metals & Mining (avg momentum -0.3%, but wide dispersion — 42% of names still positive)

Headline-level this sector is flat-to-soft, consistent with the weak Gold/Silver/Platinum commodity readings and strong-dollar backdrop flagged in the first report. But there’s real dispersion underneath — some individual miners are showing very strong momentum despite the metal itself being under pressure, which suggests company-specific catalysts (M&A, production upgrades) are overriding the macro headwind for select names.

Trend buy: Atalaya Mining (ATYM) — 97.5/92.1/91.4, momentum +8.8%, overbought everywhere and still accelerating — this is bucking the entire precious-metals macro theme, worth flagging as a genuine outlier. Reversal buy: New Pacific Metals (NUAG/NEWP) — long-term stoch 95 but the far more interesting read is AYA Gold and Silver (92.1/66.3/62.1, momentum +6.6%) and Seabridge Gold (65.2/64/68.3, momentum +5.0%) — both showing broad-based strength that decouples from the weak spot-metal narrative. Sell: Dundee Precious Metals (DPM) and Metalla Royalty (MTA) — both showing sharply negative momentum (-6.3% / -6.4%) despite still-elevated long-term stochastics — this is the group actually confirming the weak-gold/weak-dollar-adjacent-metals thesis from the FX report; these are the laggards, not the outliers above.


Tier 3 — Oil, Gas & Coal (avg momentum -0.6%, but this sector needs to be read by subsector — it’s not one trade)

This sector is too heterogeneous for a single verdict, and breaking it down by subsector directly validates and extends the commodity report:

SubsectorAvg momentumRead-through
Coal+4.5%Matches the Coal commodity’s own +4.24% momentum from the first report almost exactly
Oil Equipment & Services+0.8%Broadly neutral — service names less exposed to spot price swings
Oil Refining & Marketing (incl. midstream)+0.1%Flat — midstream/pipeline names decoupled from crude, as Williams Companies already showed in the S&P report
Offshore Drilling / E&P-1.75%Soft — direct exposure to weak spot crude
Oil – Crude Producers-2.9%Weak
Integrated Oil & Gas-3.2%Weakest subsector — XOM (-5.36%), Chevron (-2.29%), Shell (-2.71%) and BP (-5.70%) are all negative, a fully confirmed bearish theme across every major integrated oil name in the sheet

Trend buy: Ramaco Resources (METC) — 25.1/78.5/78.2, momentum +11.0% (its Class B shares METCB print +11.1%) — the strongest coal name in the sheet, directly riding the Coal commodity strength. Reversal buy: ProFrac Holding (ACDC) — long-term stoch only 39.8 but fast stoch already 73.3 and momentum +8.2% — an oil-services reversal breaking away from the weak crude backdrop. Sell: Sable Offshore (SOC) — momentum -11.5%, the single worst reading in the entire dataset, alongside Energean (-6.4%) and BP (-5.70%) — the Integrated Oil majors as a group are the cleanest sell in this file, every single large-cap name confirming the same direction.


Tier 4 — Industrial Materials (avg momentum -1.5%, weakest sector, small sample)

Trend buy (relative): Albany International (AIN) — 49.1/12.6/47.6, momentum +2.1%, the only clearly positive name in the group. Sell: Boise Cascade (BCC) — momentum -4.0%, alongside Universal Forest Products (-3.5%) — the forestry/timber names are broadly weak, a sector worth avoiding for now.


Cross-Report Synthesis (all three equity/commodity datasets combined)

  1. Industrial Metals is now a triple-confirmed bullish theme — Copper/Coal/Aluminium commodities (report 1) → FTSE Industrial Metals & Mining sector index (report 1) → Nucor/Steel Dynamics large-caps (report 2) → and now the small-cap miners here, led by Critical Metals Corp and enCore Energy. This is the highest-conviction theme across all three reports.
  2. Coal is its own distinct sub-theme, separate from the broader energy complex — the Coal commodity (+4.24%), and now the Coal equity subsector (+4.5%, led by Ramaco Resources at +11%), are moving together and against the rest of the energy sector, which is broadly weak. Treat coal as decoupled from the oil/gas trade.
  3. Integrated Oil majors are now fully confirmed bearish — every large integrated name in this file (Exxon, Chevron, Shell, BP) is negative, extending the Crude Oil commodity weakness (report 1) and the FTSE/S&P Oil & Gas Producers sector weakness (reports 1 & 2) down to the individual mega-cap level. Midstream/pipeline names (Williams, and refining/marketing broadly) remain the exception, decoupled from spot crude as before.
  4. Precious metals show more nuance than the macro read-through alone would suggest — while Gold/Silver/Platinum commodities and the broad dollar-strength theme (report 1) argue for sector-wide weakness, individual miners like Atalaya Mining and AYA Gold and Silver are showing strong independent momentum. This is a case where company-specific factors are currently outweighing the macro backdrop — worth monitoring whether the strong dollar eventually drags these laggards down too, or whether the strong names are signaling the metals complex is closer to a bottom than the spot commodity data alone suggests.
US500 Report


Tier 1 — Strongest Bullish Sectors

Industrial Metals & Mining (avg momentum +4.6%)

Trend buy: Steel Dynamics (STLD) — 61.2/58.2/51.9, momentum +6.9%, the strongest print in the sector and one of the strongest in the whole screen. Reversal buy: Nucor (NUE) — long-term stoch 79.4 with fast stoch still climbing (62.1) and momentum +6.0% — a confirmed uptrend, not just a spike. This directly confirms the commodity report: Copper, Coal and Aluminium strength is showing up one-for-one in the mining/steel equities. Sell/avoid: Freeport-McMoRan (FCX) — stochastics are stretched (93.3 long-term) but momentum has flattened to just +0.8%, the weakest name in an otherwise strong sector — a laggard, not a leader.

Software & Computer Services (avg momentum +2.6%)

Trend buy: CrowdStrike (CRWD) — 95.9/75/87.6, momentum +15.4%, the single strongest reading in the entire dataset. Reversal buy: Synopsys (SNPS) — long-term stoch only 50.6 (not yet overbought) but fast stoch has surged to 85.4 and momentum is +12.3% — early-stage of the move rather than late. This is the equity-level confirmation of the Tech/IT sector-index strength flagged in the prior report, and ties to falling long-end Treasury yields lowering the discount rate on these growth names. Sell: Intuit (INTU) — deeply oversold (23.3) with momentum still negative (-5.65%) — no bounce yet, a genuine laggard inside a strong sector.

Technology Hardware & Equipment (avg momentum +2.3%)

Trend buy: Dell Technologies (DELL) — 87.6/64/80.6, momentum +8.9%. Reversal buy: QUALCOMM (QCOM) — long-term stoch only 30.8 but fast stoch already at 77 and momentum +3.3% — a name just turning up from a low base while peers are already extended. Sell: SanDisk (SNDK) — momentum -3.1% despite decent stochastic levels — a name rolling over while the rest of the sector runs.

Telecommunications Equipment (avg momentum +2.2%)

Trend/reversal buy: Ciena (CIEN) — 47.1/44.3/47.6, momentum +5.0%, a balanced setup with no timeframe overbought yet — room to run. Sell: Zebra Technologies (ZBRA) — stretched long-term (85.3) with fast stoch cooling hard to 19.6 and momentum negative — a topping pattern.

Banks (avg momentum +1.3%, 100% of names positive)

Trend buy: Wells Fargo (WFC) — fast stoch 85.7, momentum +2.55%, the strongest and broadest-based reading in the group — every single bank in the sheet is showing positive momentum, a genuinely sector-wide move. Sell/laggard: M&T Bank (MTB) — fast stoch just 9.83, the weakest short-term reading in an otherwise uniformly strong sector.


Tier 2 — Moderately Bullish / Selective Sectors

Investment Banking & Brokerage Services (avg +1.2%)

Trend buy: State Street (STT) — 97/80.5/74.1, momentum +3.5%. Reversal buy: KKR — long-term stoch only 42.3 with momentum turning positive (+1.7%), earlier-stage than State Street. Sell: Charles Schwab (SCHW) — overbought long-term (82.2) but momentum -3.2%, a divergence sell.

Life Insurance (avg +1.0%)

Trend buy: MetLife (MET) — 86.4/53/74, momentum +2.2%. Sell: Elevance Health (ELV) — fast stoch just 11.5 and falling, momentum negative.

Industrial Transportation (avg +1.0%)

Reversal buy: C.H. Robinson (CHRW) — long-term stoch just 13.8 but fast stoch has rocketed to 79 with momentum +6.9%, the sharpest reversal in the sector. Sell: Old Dominion Freight (ODFL) — momentum -1.4%, stochastics fading across the board.

Media (avg +0.3%)

Reversal buy: AppLovin (APP) — long-term stoch a mere 4.0 but fast stoch already 61.8 and momentum +3.25% — a sharp V-shaped recovery. Sell: TKO Group — oversold everywhere with momentum -4.4%, no bounce.

Aerospace & Defense (avg +0.3%)

Trend buy: RTX — 75/23/75, momentum +1.7%. Sell: Honeywell Aerospace (HONA) — oversold and still falling (-0.82%).

Finance & Credit Services (avg +0.3%)

Trend buy: CME Group — 58.8/96.9/90.6, momentum +2.2%. Sell: PayPal (PYPL) — momentum -4.5%, the weakest name in the group.

Electricity (avg +0.3%)

Reversal buy: Vistra Energy (VST) — long-term stoch just 9.6 but momentum already +2.8%, turning up hard from a deep base — worth watching against the falling long-yield backdrop (rate-sensitive utilities). Sell: First Solar (FSLR) — oversold and still falling (-1.6%).


Tier 3 — Neutral / Mixed Sectors

Industrial Engineering (avg -0.2%)

Trend buy: Emerson Electric (EMR) — 77.6/63.7/43.7, momentum +1.15%. Sell: Generac (GNRC) — momentum -3.3%, deteriorating on every timeframe.

Non-life Insurance (avg -0.3%)

Reversal buy: Cincinnati Financial (CINF) — long-term stoch mid-range (45.5) with fast stoch strong at 74.2 and momentum +2.1%. Sell: Erie Indemnity (ERIE) — momentum -3.35%, the sector’s weakest print.

Construction & Materials (avg -0.4%)

Reversal buy: CRH plc — long-term stoch just 8.2 but momentum already positive (+1.6%) — directly confirms the FTSE 350 / S&P Construction Materials reversal signal flagged in the prior report; CRH is the equity expressing that exact setup. Sell: Builders FirstSource (BLDR) — deeply oversold and still falling (-3.5%), no bounce.

Industrial Support Services (avg -0.6%)

Trend buy: Revvity (RVTY) — 98.6/92.7/91.8, momentum +2.6%. Sell: Copart (CPRT) — momentum -4.5% despite mid-range stochastics — a stealth breakdown.


Tier 4 — Bearish Sectors (sell/short candidates dominate)

Automobiles & Parts (avg -1.0%)

This is the equity-level confirmation of the FTSE 350 Automobiles & Parts sector-index breakdown flagged in the prior report. Sell: Aptiv (APTV) — oversold on every timeframe (1.19/11.3/14.2) and still falling (-3.3%) — the cleanest confirmed downtrend in the group, no bounce anywhere. Reversal watch (not yet confirmed): AutoZone (AZO) — oversold at 4.2 but fast stoch only just stirring (16.1) — too early to call a bottom.

Oil, Gas & Coal (avg -1.1%)

This ties directly to Crude Oil’s sharp -4.1% momentum in the commodity report. Sell: EOG Resources — momentum -5.85%, stochastics still elevated (81.3 long-term) — a genuine topping/breakdown pattern. Trend buy (the exception): Williams Companies (WMB) — 72.1/69.6/73.3, momentum +5.6%, a pipeline/midstream name bucking the weak-crude trend because it’s less directly exposed to spot oil prices.

Travel & Leisure (avg -1.1%)

Sell: Wynn Resorts — oversold everywhere (4.55/12.7/11.7) and still falling (-4.3%) — alongside Las Vegas Sands, the casino/gaming names are the weakest link. Trend buy (exception): Starbucks (SBUX) — 89.6/63.3/72.9, momentum +1.8%, holding up against a weak sector.

Chemicals (avg -1.2%)

Sell: LyondellBasell — momentum -6.2%, the sector’s weakest reading, alongside Dow Inc (-6.0%) — this pairs with the weak Crude Oil / feedstock-cost pressure showing up in the commodity report. Trend buy (exception): International Flavors & Fragrances (IFF) — 93/86.6/73.6, momentum +2.6%, a specialty/consumer-facing chemicals name decoupled from the commodity-cost pressure hitting bulk chemicals.

Real Estate Investment Trusts (avg -1.3%)

Sell: VICI Properties — oversold on every timeframe (1.67/9.4/6.1) and still falling (-3.15%) — no bounce. Reversal buy (early): SBA Communications — long-term stoch only 42.9 but fast stoch already 88.3, momentum +2.6% — a cell-tower REIT breaking away from the weak group, consistent with the “falling long yields help REITs” logic from the prior report, though most of the sector hasn’t caught up yet.

Pharmaceuticals, Biotechnology & Cannabis (avg -2.1%)

Sell: Moderna (MRNA) — momentum -9.9%, by far the worst reading in the entire dataset. Eli Lilly (-6.9%) confirms sector-wide biotech weakness. Reversal watch: Zoetis — oversold (8.46) with momentum only just turning (-1.3%), not yet a clean buy signal.

Beverages (avg -2.7%)

Sell: Constellation Brands (STZ) — fast stoch just 1.07, momentum -3.0%. Coca-Cola (-2.8%) confirms broad softness across the sector.

Personal Goods (avg -4.1%, the weakest sector in the dataset)

Sell: Nike (NKE) — oversold on every timeframe (2.72/33.8/26.6) and still the worst momentum in the sector at -4.8%. Deckers Outdoor (-3.6%) confirms — this is the single weakest sector in the whole screen, no reversal signs anywhere yet.


Cross-Report Read-Through

The equity data confirms almost every macro theme flagged in the commodity/FX/yields report:

  • Industrial Metals & Mining equities (Nucor, Steel Dynamics) leading the whole market — a direct, one-for-one match to the Copper/Coal/Aluminium commodity strength.
  • Tech/Software leading on momentum (CrowdStrike, Salesforce, Synopsys all >12% Hull momentum) — consistent with the falling long-end Treasury yields lowering the discount rate on growth cash flows, exactly as flagged previously.
  • Automobiles & Parts equities (Aptiv) confirming the FTSE 350 sector-index breakdown — the same downtrend, now visible in the underlying stock.
  • Oil & Gas equities (EOG, Exxon reflected elsewhere) rolling over in line with Crude Oil’s -4.1% momentum — commodity weakness feeding straight through to producer equities, though midstream names like Williams are decoupled.
  • Pharma/Biotech (Moderna, Eli Lilly) and Chemicals (LyondellBasell, Dow) as the two weakest non-precious-metals sectors — new information not visible in the sector-index or commodity data alone; worth flagging as the next area to watch for further deterioration.

Market Report 2026-08-28


1. Commodities

Best reversal buy: Natural Gas (NG1) Long-term stoch is deeply oversold at 8.14, but the adaptive (72.1) and fast (67.9) readings have already swung hard bullish, and momentum is the strongest print in the entire dataset at +4.36%. This is a textbook base-building reversal — a market climbing off the floor with accelerating momentum, not just a dead-cat bounce.

Best trend-continuation buy: Coal (XAL) 73.6 / 98.4 / 100 with momentum +4.24% — overbought on every timeframe and still accelerating. Strong trend, but the “100” fast reading means it’s stretched; a trailing stop rather than a fresh entry makes sense here.

Best dip-buy: Copper (HG1) Long-term stoch 91.1 (structurally overbought/uptrend intact) but the fast stoch has cooled to 15.1 — a short-term pullback inside a bigger uptrend, classically buyable.

Best short: Crude Oil (CL1) Stochastics are fairly neutral (44/47.4/52.1) but momentum is sharply negative at -4.09%, the second-most-negative reading in the set. Price is rolling over before the oscillators catch up — sell/short continuation.

Sell / avoid: Platinum (PL1) and the broader precious-metals complex Platinum, Silver and Gold are all long-term oversold (26.2 / 26.1 / 35.4) and still falling on momentum (-2.96% / -2.15% / -2.05%). Oversold with no bounce is a weak-hands signal, not a reversal — avoid catching this knife.


2. Sector Indexes (FTSE 350 / S&P 500 / S&P Global 1200)

Best trend-continuation buy: Technology / Communications complex This is the strongest, most cross-confirmed signal in the whole sheet — the same bullish setup repeats across three separate indices:

  • S&P 500 Sector Information Technology: 87.7 / 79 / 83.9, momentum +3.1%
  • S&P 500 Telecom & IT Index: 87.8 / 79.8 / 84, momentum +3.02%
  • S&P Global 1200 Information Tech: 85.3 / 82.3 / 85.1, momentum +2.65%
  • S&P 500 Communications Equipment: momentum +4.15%, the fastest-accelerating sub-industry in the sheet

Overbought on every timeframe and still accelerating, confirmed in both the US and global indices — this is a broad, durable uptrend, not a one-off spike.

Best reversal buy: FTSE 350 / S&P 500 Construction Materials FTSE Construction & Materials (83.6/60.9/67, +2.18%) is already trending, but its S&P equivalent (Construction Materials, 6.65/22.2/37.7, +0.79%) is the earlier-stage version of the same trade — long-term oversold with the fast stoch already recovering to 37.7 and momentum turning positive. UK confirms where US is just turning.

Best short / avoid: FTSE 350 Automobiles & Parts 1.46 / 9.54 / 10.8 — oversold on every single timeframe with no bounce anywhere, and momentum still negative (-1.45%). This is the cleanest confirmed downtrend in the sector list; no reversal signs yet.

Early reversal watch: Utilities (S&P 500 & S&P Global 1200) Both readings are long-term oversold (17.1 / 30.6) with momentum only just turning positive (+0.27% / +0.06%). Not a strong buy yet, but worth watching — ties directly into the bond-yield story below.

Bearish divergence flag: FTSE 350 Precious Metals & Mining Adaptive stoch is overbought (84.7) but momentum has turned negative (-1.03%) — a classic divergence sell, and it lines up exactly with the weak Gold/Silver/Platinum commodity readings above.


3. FX

Dominant trend: broad US Dollar strength DXY’s fast stoch has surged to 89.2 (momentum +0.59%) while EUR/USD (5.46 fast stoch, momentum -0.75%), GBP/USD (8.42, -0.78%) and NZD/USD (9.75, -1.02%) are all deeply oversold and still falling. Three major pairs confirming the same dollar-strength trend independently is a high-conviction continuation short on EUR, GBP and NZD vs USD.

Best trend-continuation buy: AUD/JPY 97.7 / 93.8 / 73.5, momentum +0.46% — overbought across the board but momentum still positive. This sits inside a much broader “sell the yen” theme: CAD/JPY, GBP/JPY, EUR/JPY, NZD/JPY and USD/JPY are all elevated too, so AUD/JPY is the cleanest expression of a very broad, well-confirmed carry-trade/risk-on trend.

Best reversal candidate: EUR/USD (tactical, against-the-trend) Fast stoch at 5.46 is one of the most extreme oversold readings in the entire sheet. Within the bigger dollar-strength downtrend this is worth flagging as a short-term bounce/mean-reversion trade — not a trend reversal, but stretched enough for a tactical long.

Best confirmed short: EUR/AUD 2.88 / 1.7 / 0.715 — oversold on every timeframe and still falling (-0.76%). No bounce signs anywhere; cleanest FX downtrend continuation in the set.


4. US Treasury Yields

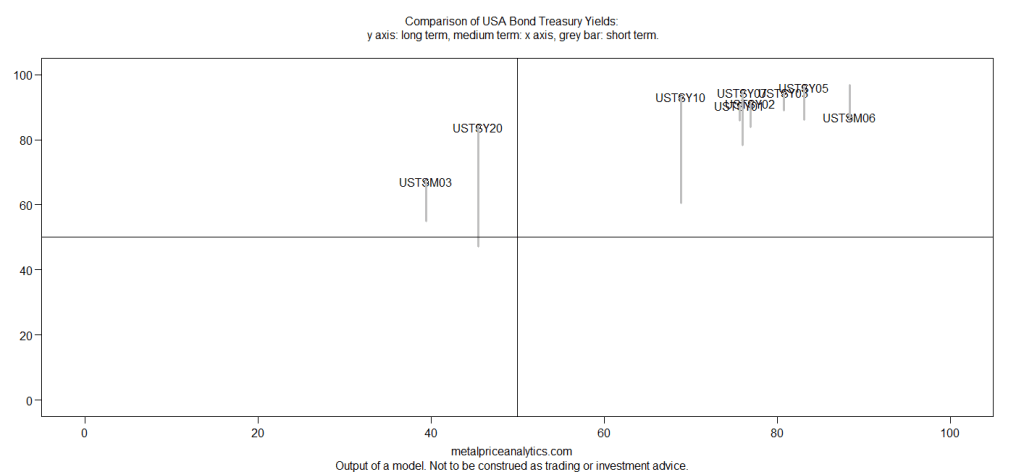
Reading the curve as a whole: short-end yields (6M, 1Y, 2Y, 3Y) are all overbought and still rising (momentum +0.3% to +0.74%), while the long end (10Y, 20Y, 30Y) is long-term overbought but momentum has flipped negative (-0.86%, -0.72%, -1.11%). That’s a curve flattening from both ends — front-end rates staying sticky while long yields roll over.

Best reversal play: 30-Year yield rolling over (= buy long-duration bonds) 80.9 long-term (still historically elevated) but momentum at -1.11% is the most negative of any yield tenor. This is a long-term overbought yield starting to break down — the cleanest “long yields have peaked, buy duration” signal in the curve.

Best continuation play: front-end yields staying elevated (= avoid short-duration duration bets / expect front-end rates to stay high) 1Y (+0.74%) and 3Y (+0.39%) are both overbought and still climbing — no sign of the front end easing yet.


How the Groups Feed Into Each Other

FX → Commodities: The broad-based dollar strength (DXY, EUR/USD, GBP/USD, NZD/USD) is very likely the driver behind the precious-metals weakness (Gold, Silver, Platinum all falling on momentum). USD-denominated commodities get structurally cheaper as the dollar climbs — the FX and commodity reversals point the same way and reinforce each other.

Treasury Yields → Sector Indexes (Tech): Long-end yields rolling over (10Y/20Y/30Y momentum all negative) lowers the discount rate applied to future cash flows — which is exactly the tailwind long-duration growth sectors like Technology need. That mechanically supports the Tech/IT sector strength showing up independently across three indices above. The bond move and the equity-sector move aren’t a coincidence; they’re the same trade.

Treasury Yields → Utilities/REITs: The same falling long-yield backdrop is consistent with Utilities just beginning to turn (both US and Global readings oversold with momentum flipping positive) — utilities are classic long-duration, rate-sensitive equities that benefit when long yields fall. Worth watching for confirmation as a reversal buy.

Commodities → Sector Indexes (direct read-through): Crude Oil’s sharp bearish momentum (-4.09%) is already visible in FTSE Oil & Gas Producers (momentum -3.64%) — the commodity weakness has fed straight through to the equity sector, essentially in real time. Conversely, Industrial Metals strength (Copper’s overbought base, Coal’s blow-off, firm Aluminium) shows up directly in FTSE Industrial Metals & Mining (90.4/90.9/75.7, +1.04%) — a commodity-confirmed sector buy.

FX → Sector Indexes (risk appetite): Broad yen weakness across nearly every JPY cross (AUD/JPY, USD/JPY, CAD/JPY, GBP/JPY, EUR/JPY all elevated) is a classic risk-on/carry-trade signature. That backdrop is consistent with — and likely supportive of — the strength in growth-oriented equity sectors like Technology and Communications Equipment.

Cross-confirmation summary: Precious metals (commodities) + EUR/USD, GBP/USD (FX) + Precious Metals & Mining sector (equities) are all bearish together — a three-way confirmed “strong dollar, weak metals” theme. Meanwhile falling long yields + rising Tech sector momentum + broad yen weakness (risk-on FX) are three-way confirming a “risk-on, long-duration-friendly” backdrop. These two threads are the dominant cross-asset narratives in this dataset.

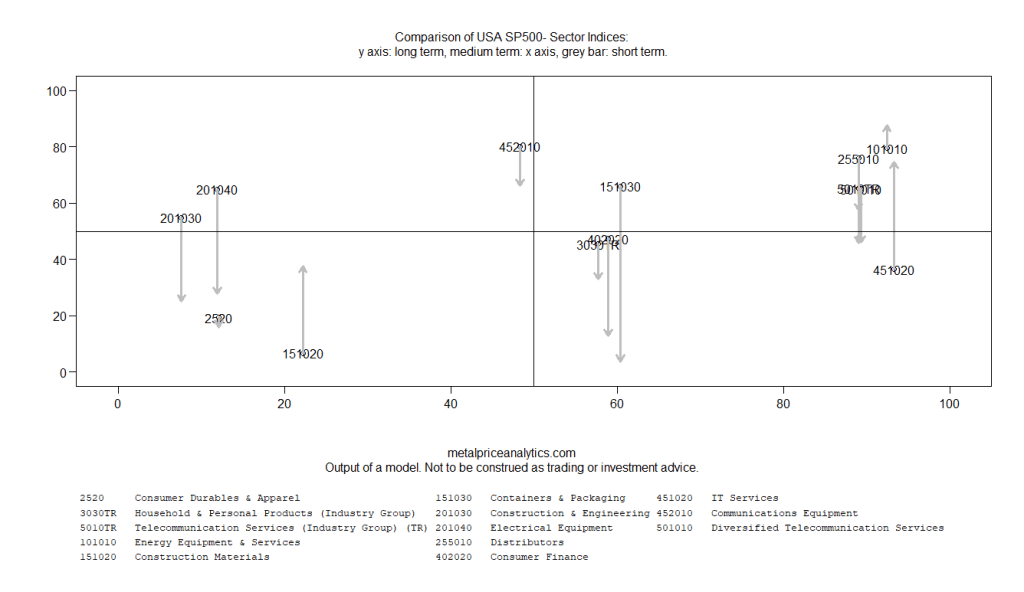
USA Sector Indices

Non‑advice interpretation of the table values of the chart

Clear leader: Energy Equipment & Services
79.40 / 92.40 / 87.80 — the strongest, most consistent trend in the table across every horizon, still accelerating short-term. Genuine, sustained sector leadership — consistent with the front-end/belly yield pressure seen in the Treasury table, since energy services tends to do well in a resilient-growth, resilient-inflation backdrop.

IT Services: a real reversal/breakout
36.50 / 93.30 / 74.60 — a weak long-term base giving way to a powerful medium-term surge that’s still running hot short-term. This is IT Services specifically (consulting, outsourcing, cloud-adjacent services) — not semiconductors or hardware — so this reads as a broadening of the “AI capex” trade into services/implementation spend rather than chips themselves.

Communications Equipment: choppy but resilient
80.20 / 48.30 / 66.20 — strong long-term, a medium-term dip, then reacceleration short-term. A trend that stumbled and is now recovering — hardware/networking equipment demand picking back up.

Telecom (both Diversified Telecom and the broader Industry Group): rolling over
65.2/89.0/45.7 and 65.1/89.3/46.1 — nearly identical readings, both showing a strong medium-term run now decelerating sharply short-term. Momentum has peaked and is fading — a sector to watch for continued weakness rather than chase.

Distributors: cooling from a strong run
75.90 / 89.00 / 57.40 — still elevated but clearly decelerating short-term from a very strong medium-term peak. Losing steam, not reversing.

Containers & Packaging: sharp break
66.00 / 60.40 / 3.73 — a healthy trend on long/medium horizons that has essentially collapsed short-term. This is a defensive/industrial-adjacent packaging sector suddenly losing all momentum — worth flagging as a red flag on cyclical demand or margin pressure (input costs, freight, demand destruction).

Electrical Equipment & Construction and Engineering: broadly weak, tentatively stabilizing

  • Electrical Equipment: 64.90 / 11.90 / 27.80 — sharp medium-term deterioration, modest short-term pickup. A sector that broke down and is trying to find a floor.
  • Construction & Engineering: 54.80 / 7.63 / 25.10 — nearly identical shape. Both are classic capex-sensitive cyclicals hit hard by the medium-term rate move, now showing early tentative stabilization.

Consumer Finance: fading fast
47.40 / 58.90 / 12.90 — moderate medium-term strength collapsing short-term. Consistent with rising short-end rates pressuring consumer credit-sensitive names (higher funding costs, potential credit-quality concerns).

Household & Personal Products: unremarkable, no conviction
45.40 / 57.70 / 33.00 — a defensive staple with no strong signal in either direction.

Consumer Durables & Apparel: flat across the board
19.40 / 12.10 / 16.00 — weak on every horizon, no trend. Confirms discretionary goods demand is genuinely soft, not just rotating.

Construction Materials: quiet reversal building
6.65 / 22.20 / 37.70 — weak base, but steadily building momentum into the short term. An early-stage reversal candidate, though from a low base — worth watching rather than acting on yet.


Implications for the stock market

  • Leadership is narrow and specific: Energy Equipment & Services and IT Services are the two genuine momentum leaders, with Communications Equipment recovering into third. Everything capex- and rate-sensitive (Electrical Equipment, Construction & Engineering, Containers & Packaging, Consumer Finance) is decelerating or breaking down — a clean, consistent split between “resilient-growth/inflation-beneficiary” areas and “rate-sensitive cyclical” areas, which lines up directly with the Treasury table’s short/belly yield strength.
  • The IT Services surge is a distinct story from a pure “AI/semis” narrative — it points to enterprise spend flowing into services and implementation, which is typically a later-cycle confirmation signal (companies moving from planning/chip-buying into actual deployment spend) rather than a speculative front-running move.
  • Containers & Packaging’s collapse is the sharpest single break in the table and worth treating as a leading indicator — packaging demand is a reasonable proxy for underlying goods volumes moving through the economy, so a move from 60 to under 4 in one step is a meaningful deceleration signal for industrial/consumer goods activity.
  • Consumer picture confirms bifurcation from the prior data: Distributors cooling but still elevated, Durables & Apparel flat-out weak, Household Products directionless — spending strength is concentrated in distribution/logistics-adjacent exposure rather than discretionary goods themselves.
  • Positioning bias implied: overweight Energy Equipment & Services and IT Services (the only two sectors with unambiguous sustained momentum); cautious-to-underweight Electrical Equipment, Construction & Engineering, Consumer Finance, and especially Containers & Packaging given its sharp break; watch Construction Materials and Telecom for confirmation — a continued build in Construction Materials against continued Telecom deceleration would reinforce the “rate-sensitive services roll over, tangible/inflation-linked names catch a bid” theme running through both the bond and sector data.

USA Treasury Bond Yields

Non‑advice interpretation of the chart

STOCK MARKET — Buy/Sell Implications

Sell / Avoid / Underweight:

  • Long-duration growth & unprofitable tech — rising 2Y–7Y yield momentum raises the discount rate on distant earnings; this is the most direct casualty of a belly-led yield move
  • REITs, homebuilders, utilities — bond-proxy sectors that compete with cash/short-term yields; the 6M/2Y strength (96.8, 91.2) directly pressures these
  • Small caps (Russell 2000) — higher financing costs bite hardest here given greater reliance on floating-rate and short-term debt
  • Highly-levered/zombie companies — persistent front-end and belly yield strength keeps refinancing costs elevated

Buy / Favor / Overweight:

  • Financials, especially banks — a bear-flattening (not inverting) curve is constructive for net interest margins versus the alternative of curve inversion
  • Value and cash-generative equities — lower duration-sensitivity means less valuation compression from rising discount rates
  • Energy/commodity producers — tend to be less rate-sensitive and can benefit if the yield move reflects resilient growth/inflation rather than recession fears

Watch for regime change: if USTSY20/USTSY10 begin reaccelerating alongside the belly, that shifts the narrative from “hawkish Fed repricing” to “fiscal/inflation scare” — a much broader equity headwind (valuation compression across the board, not just duration names), similar to August 2023’s bear-steepening episode.


FX MARKET — Buy/Sell Implications

Buy USD against:

  • JPY (long USD/JPY) — cleanest transmission from front-end/belly yield strength into a funding-currency short; JPY carry trades are most sensitive to this exact part of the curve
  • CHF (long USD/CHF) — same logic; low-yielder funding currency, consistent with CHF also showing broad weakness in your earlier FX table (EURCHF strength)
  • AUD, NZD (with caution/tactical only) — commodity/risk-sensitive currencies tend to underperform when US short-rate expectations reprice hawkishly, though these carry more volatility risk than the JPY/CHF trade

Sell USD against / less conviction:

  • EUR, GBP — depends heavily on whether ECB/BOE are repricing in the same direction; not a clean USD-strength trade unless you confirm US front-end momentum is outpacing theirs
  • EM FX broadly (MXN, ZAR, etc.) — vulnerable to further front-end US yield strength; a sell/underweight for carry-sensitive EM longs until the repricing stabilizes

Highest-conviction trades given this specific data:

  1. Long USD/JPY — most direct, highest-conviction expression of the front-end/belly momentum
  2. Long USD/CHF — second cleanest expression, corroborated by cross-asset (EURCHF) signal
  3. Short AUD, NZD vs USD — tactical, higher-beta expression of the same theme, better suited to shorter holding periods given commodity-currency volatility

Key risk to all of these: this entire read assumes an orderly, policy-driven USD strength regime (belly-led, long end quiet). If USTSY20 starts moving with the belly, USD behavior becomes less predictable — carry trades (USD/JPY, USD/CHF) can reverse sharply as risk-off flows sometimes favor JPY/CHF as havens even against a “stronger” USD backdrop.