Non‑advice interpretation of the chart
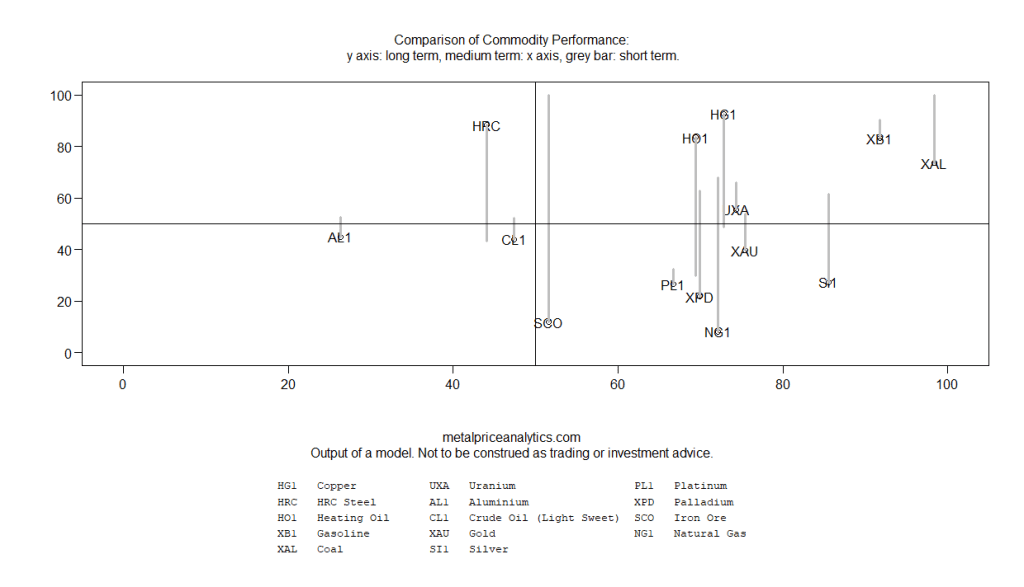
Trend plays (momentum strong and holding across all timeframes): Coal is the standout — momentum actually builds through each period, ending at a maxed-out short-term score, which is a clean continuation signal. Gasoline is a close second, consistently strong across long, medium, and short term with barely any fade. Uranium is a more moderate but still valid trend candidate, rising from long to medium and holding up reasonably well short-term. Worth noting Copper and HRC Steel look strong long-term but fade hard short-term (Copper 92.7 down to 48.8, Steel 88.4 down to 43.2) — that’s cooling momentum, not a trend play, despite the eye-catching long-term numbers.
Recovery plays (weak long-term base, improving into medium/short-term): Iron Ore shows the most dramatic turnaround — bottom of the pack long-term (11.8) but a maxed-out short-term reading (100.0), though a jump that sharp is worth double-checking rather than taking at face value. Natural Gas has the weakest long-term score in the whole table (8.1) but shows a sustained, not just one-off, recovery through medium (72.1) and short-term (67.9), which makes it more convincing than Iron Ore’s single-timeframe spike. Silver and Palladium follow a similar shape — deep long-term laggards that staged solid medium-term recoveries and are still holding up reasonably well short-term.


