FX EUR

Non‑advice interpretation of the chart

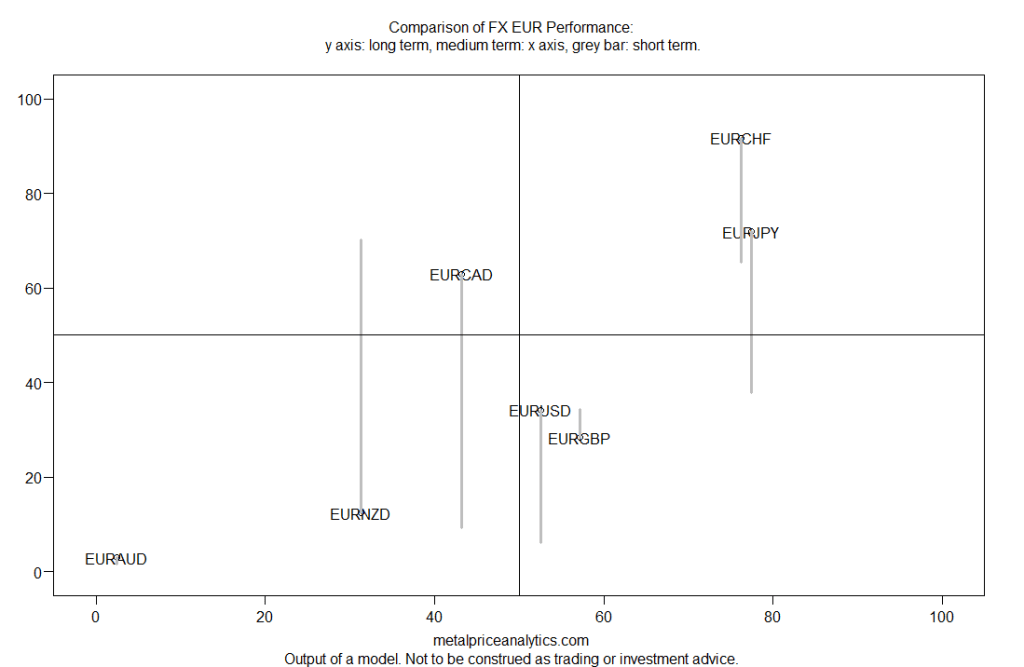
Best trend-following buy: EURCHF
91.70 / 76.20 / 65.40 — high and holding across all three timeframes. This is the most consistent uptrend in the set: momentum is easing slightly into the short term but remains firmly elevated, meaning the trend is mature but intact. This is the cleanest “stay long / add on dips” candidate — no timeframe conflict.

Best reversal buy: EURNZD
12.40 / 31.30 / 70.10 — the mirror image of EURCHF. Long and medium term show a pair that’s been structurally weak, but short-term momentum has just surged to the top of the range. That’s a classic early-stage reversal signature: the older trend was down, but fresh short-term strength suggests a turn is underway. Higher risk than EURCHF since it’s unconfirmed on longer horizons, but the best asymmetric reversal setup here.

Best trend-following sell: EURCAD
62.90 / 43.20 / 9.39 — a clean, steady decay across all three horizons. Unlike EURNZD’s sharp turn, this is a gradual, orderly deterioration — momentum bleeding out at every timeframe, with short-term collapsing to near-zero. This is the strongest “stay short / trend continuation to the downside” case.

Worth flagging separately: EURAUD
2.96 / 2.49 / 1.59 — uniformly weak across every timeframe. This isn’t a fresh reversal or an active sell signal so much as a pair that’s already fully exhausted/oversold on this measure — more of a “nothing left to confirm a short here” case, and a candidate to watch for a bounce rather than chase further downside.
FX USD

Non‑advice interpretation of the chart

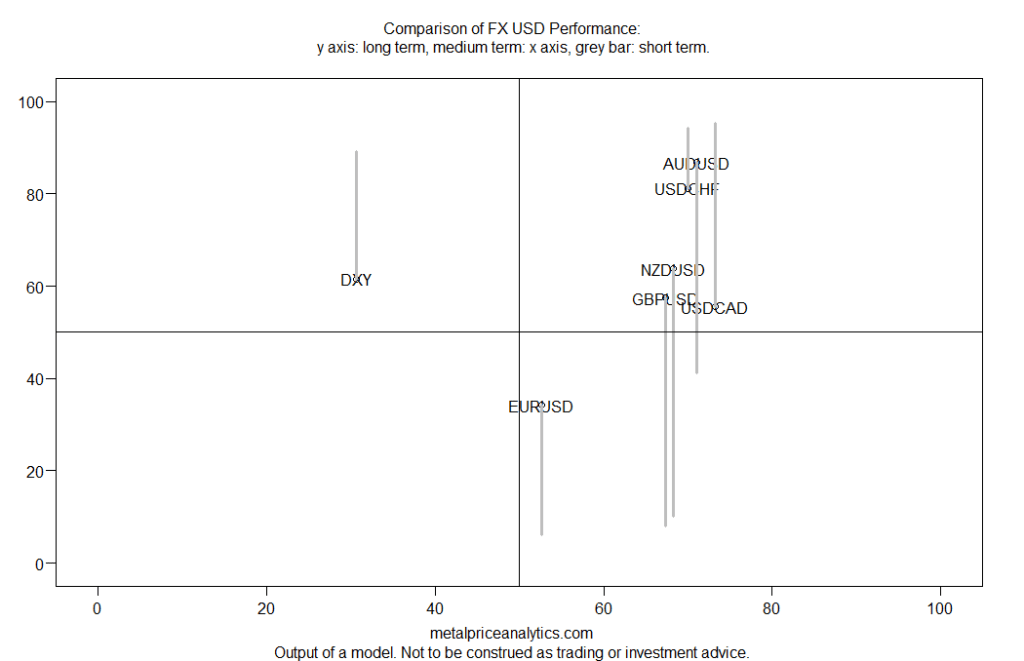
Trend-continuation plays (all three timeframes aligned in the same direction):

  • Buy — USDCHF: 81.2 / 70.0 / 94.2. All three timeframes are strong and short-term is accelerating hardest of the whole table. This is the cleanest aligned bullish setup — no divergence between timeframes to worry about.
  • Buy (secondary) — USDCAD: 55.5 / 73.2 / 95.4. Medium and short term are both very strong and accelerating; long-term is only middling but not a drag. Good momentum continuation candidate, slightly less “complete” than USDCHF since the long-term base is weaker.
  • Sell — EURUSD: 34.2 / 52.6 / 6.16. Weak on every timeframe and short-term has essentially collapsed. This is the mirror image of USDCHF — the cleanest aligned bearish setup on the table.

Reversal plays (timeframes disagreeing — usually the tell for exhaustion or an early turn):

  • NZDUSD — watch for downside reversal: 63.8 / 68.3 / 10.1. Long and medium term still show a decent uptrend, but short-term has fallen off a cliff. That’s classic momentum divergence — the older trend hasn’t caught up to the fact that near-term buying has dried up. Favors a short-term short/fade of the recent strength, or waiting for the short-term score to bottom and turn up before buying the dip.
  • GBPUSD — same pattern, less severe: 57.4 / 67.3 / 8.04. Medium-term uptrend intact but short-term has essentially stalled out. Same logic as NZDUSD — a stalling/topping signal within an otherwise okay medium-term trend rather than a fresh breakdown.
  • DXY — watch for upside reversal: 61.6 / 30.6 / 89.2. This is the interesting one — medium-term is the weakest reading on the whole table (30.6) but short-term has spiked hard to 89.2. That’s a sharp reversal-up signature: the dollar index was fading on a medium-term view but has just turned aggressively. Worth flagging as an early long candidate, though it’s the freshest/least confirmed signal here since it’s a one-timeframe move against a weak medium-term backdrop.

Watchlists 2026-08-28

Non‑advice interpretation of the chart

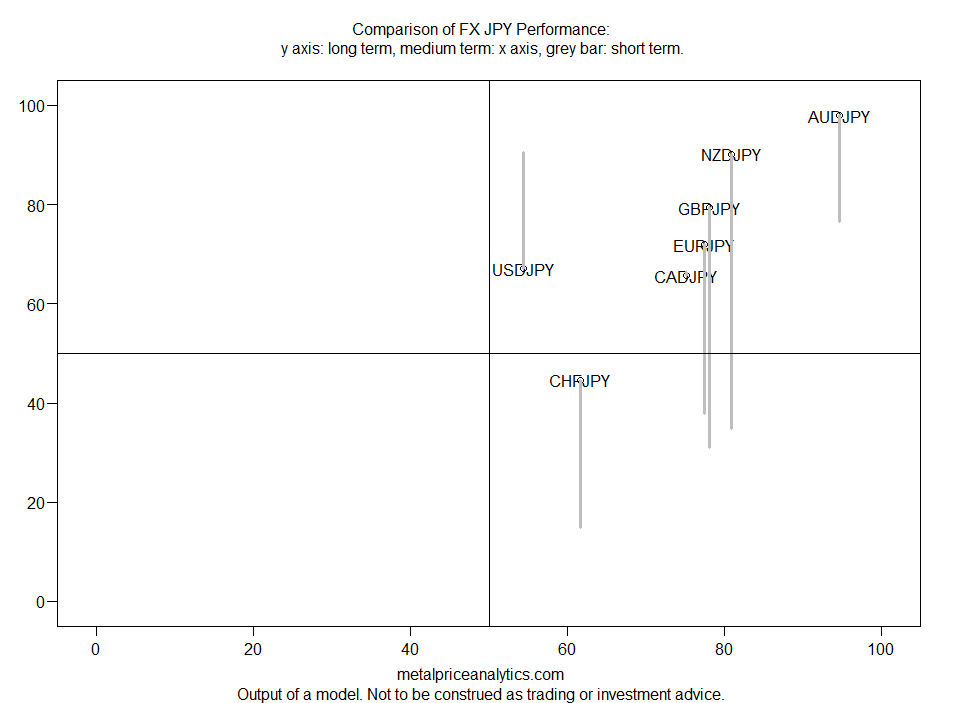
Top Trend Buys (JPY Weakness)

  1. AUDJPY – strongest across all horizons
  2. NZDJPY – strong but short-term dip
  3. GBPJPY – strong but short-term dip
  4. CADJPY – stable trend
  5. EURJPY – medium-term strongest, but softer elsewhere

Top Reversal Sell (JPY Strength Rebound)

  • CHFJPY – weakest across all horizons → best reversal candidate

Short-Term Momentum Buy

  • USDJPY – huge short-term strength, weak long-term → tactical only

Watchlist 2026-08-29

Non‑advice interpretation of the chart

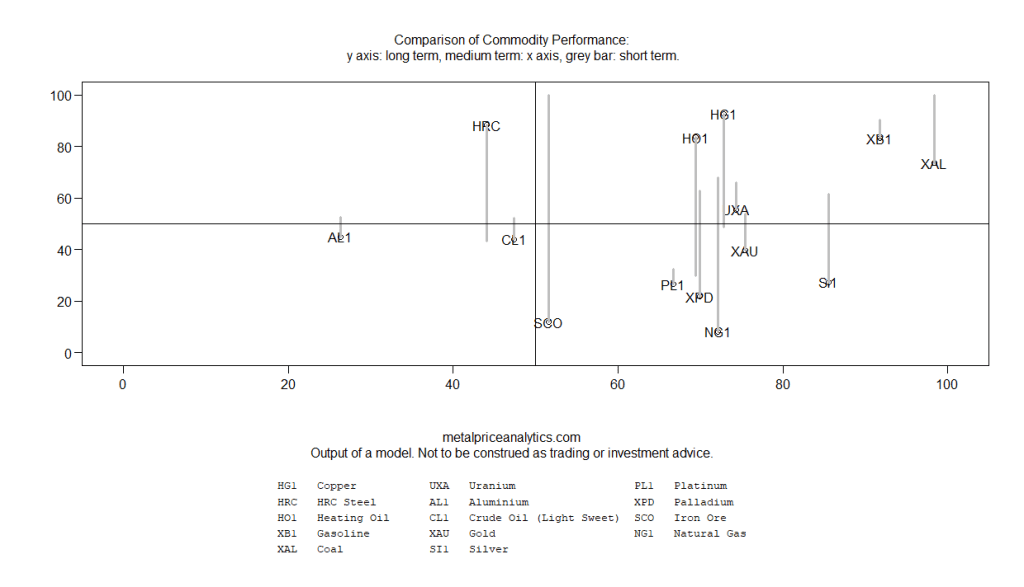
Trend plays (momentum strong and holding across all timeframes): Coal is the standout — momentum actually builds through each period, ending at a maxed-out short-term score, which is a clean continuation signal. Gasoline is a close second, consistently strong across long, medium, and short term with barely any fade. Uranium is a more moderate but still valid trend candidate, rising from long to medium and holding up reasonably well short-term. Worth noting Copper and HRC Steel look strong long-term but fade hard short-term (Copper 92.7 down to 48.8, Steel 88.4 down to 43.2) — that’s cooling momentum, not a trend play, despite the eye-catching long-term numbers.

Recovery plays (weak long-term base, improving into medium/short-term): Iron Ore shows the most dramatic turnaround — bottom of the pack long-term (11.8) but a maxed-out short-term reading (100.0), though a jump that sharp is worth double-checking rather than taking at face value. Natural Gas has the weakest long-term score in the whole table (8.1) but shows a sustained, not just one-off, recovery through medium (72.1) and short-term (67.9), which makes it more convincing than Iron Ore’s single-timeframe spike. Silver and Palladium follow a similar shape — deep long-term laggards that staged solid medium-term recoveries and are still holding up reasonably well short-term.