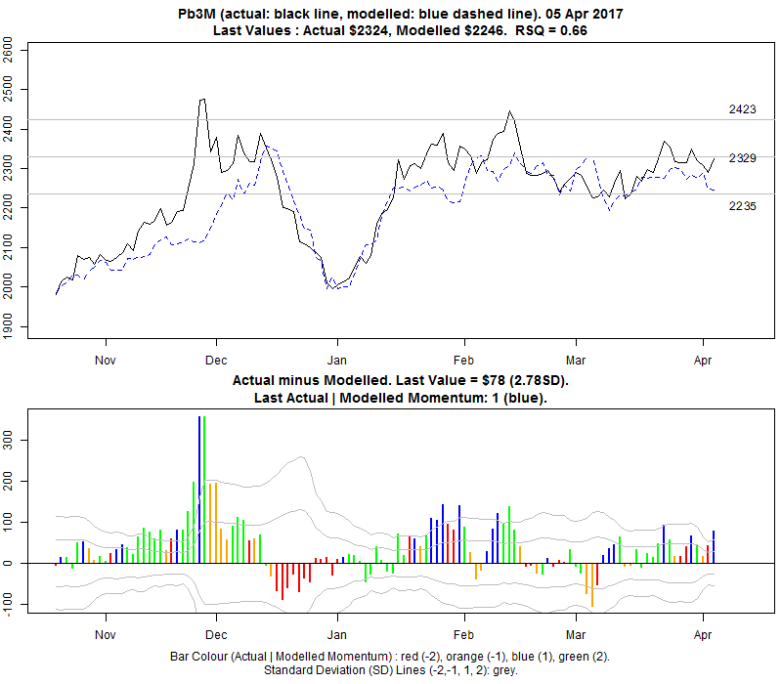
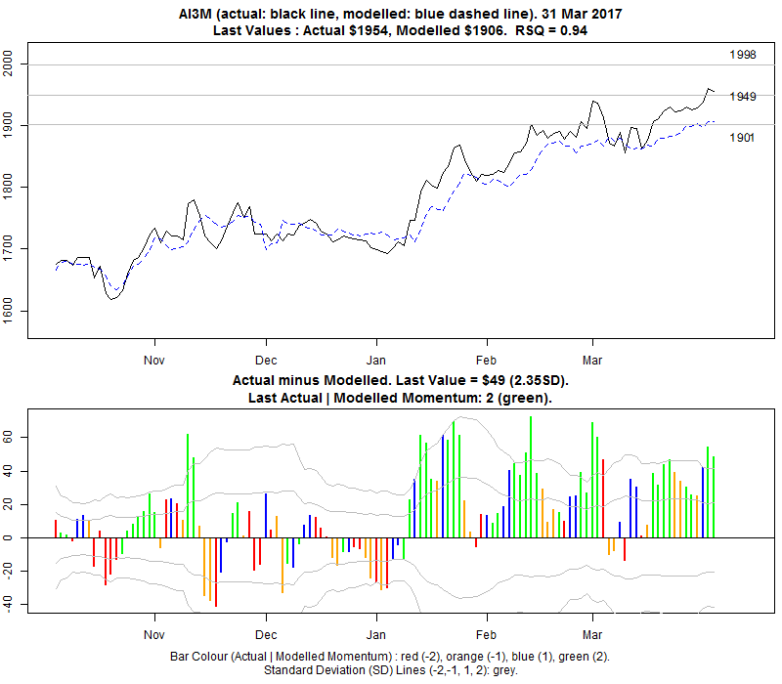
- The upper chart shows the actual and modelled prices and the forecast 5 day support, mid and resistance lines.
- The lower chart show the actual minus modelled price difference (coloured or grey bars) and the 20 day standard deviation grey lines (-2,-1,1,2).
- When the price difference is over or under two standard deviations there is an increasing probability that the actual price will retrace towards the modelled value.
- In order to help determine whether the price is continuing to move away from the model or is beginning to retrace towards it, the short term momentum of the actual and modelled price is also calculated for the 3M price (Actual|Modelled momentum) and is ranked from -2 to 2.
- When the short term actual and modelled momentum are both down: -2 (red bar). When the short term actual momentum is down but the modelled is up: -1, (orange bar). When the short term actual momentum is up but the modelled is down: 1 (blue bar). When the short term actual momentum and the modelled are both up: 2 (green bar).
- The momentum is not shown in the case of the spreads as it is more useful in markets that show a persistent trend over a longer time period.
- The charts for 3M Copper, Aluminium, Nickel, Zinc, Lead and Tin are on page 2, 4, 6, 8, 10, 12 of the Daily Report.
Past Examples: